 Community Development Agency
 GENERAL PLAN, SPECIFIC PLANS, AND ORDINANCES
- ZONING
- CODE ENFORCEMENT
- RESIDENTIAL DESIGN GUIDELINES AND STANDARDS
- LAND USE PLANNING FORMS
- BOARDS AND COMMISSIONS
- Planning Commission
- East County Board of Zoning
Adjustments - West County Board of Zoning
Adjustments - Agricultural Advisory Committee
- Castro Valley Municipal Advisory
Council - Eden Area Municipal Advisory
Council - Fairview Municipal Advisory
Council - Sunol Citizens Advisory Council
- Parks, Recreation & Historical
Commission
- MEETINGS
- PENDING LAND USE PROJECTS
- CEQA PROJECTS
- SURFACE MINE PERMITS
- CLIMATE CHANGE AND SUSTAINABILITY
- WASTE PROGRAM
- ALTAMONT OPEN SPACE
- QUICK LINKS
- ARCHIVE
Planning staff have identified 569 different parcels of land as part of the Sites Inventory for the 2023 Housing Element update. A full description of these parcels will be shared upon the publishing of the second draft Housing Element in April 2024.
You can download an excel spreadsheet describing the Sites Inventory here.
Maps of Draft Inventory Sites / Mapas del inventario preliminar de sitios / 地块清单草案分布图
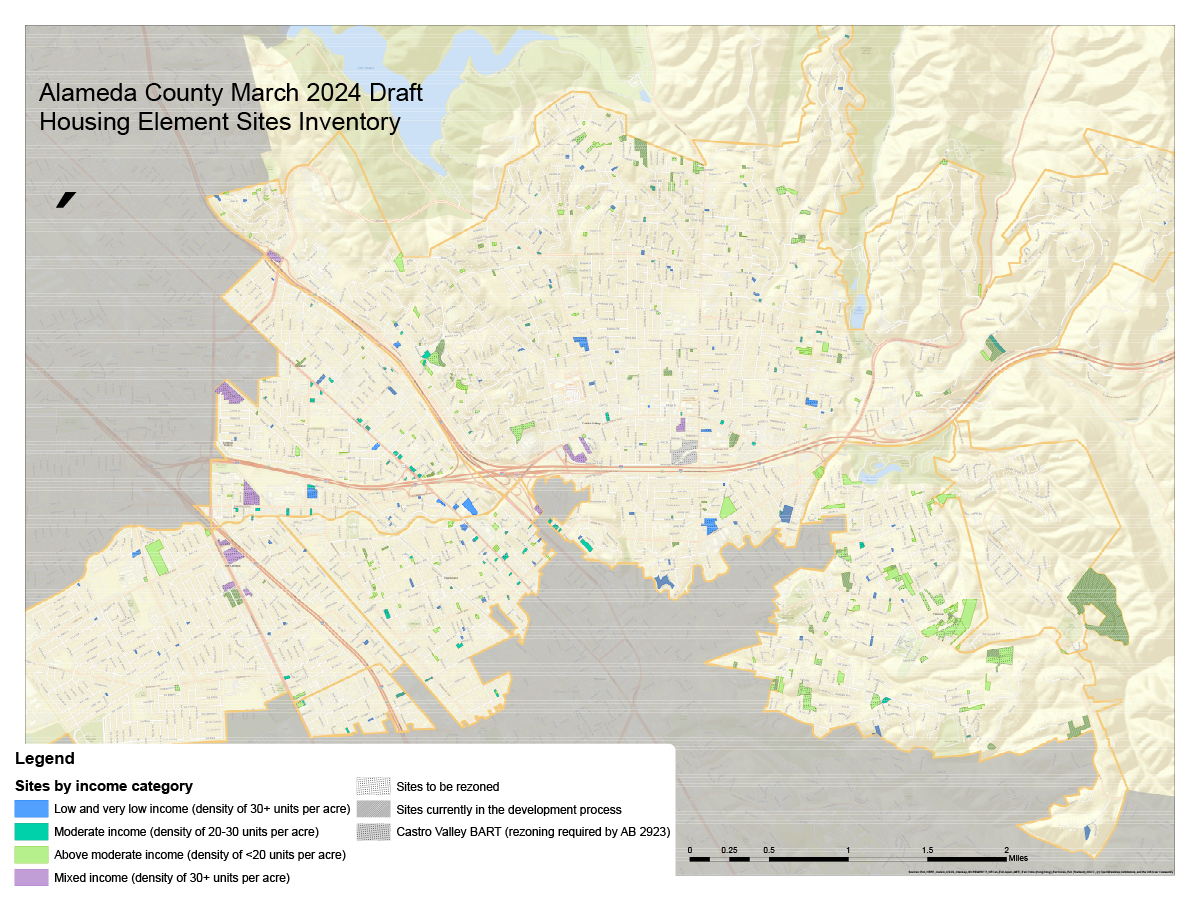
Map of the urban Unincorporated areas
Ashland | Cherryland | Hayward Acres and San Lorenzo | Castro Valley (west) | Castro Valley (south) | Castro Valley (east) | Fairview | East County
Note: the sites outlined in this map show the shape of the parcels, not the footprint of potential future housing development. For some sites proposed for the inventory, only part of the lot may be proposed for housing, such as a field behind a church or school. Possible future housing development does not require the replacement of existing uses. For example, a parking lot could turn into new housing and a parking structure.
Nota: los sitios marcados en este mapa muestran la forma de las parcelas, no la huella del posible desarrollo de viviendas futuras. En el caso de algunos sitios propuestos para el inventario, solo una parte del lote puede proponerse para la vivienda, como un campo detrás de una iglesia o escuela. El posible desarrollo futuro de viviendas no requiere la sustitución de los usos existentes. Por ejemplo, un estacionamiento podría convertirse en unas viviendas nuevas y una estructura de estacionamiento.
备注: 在本地图中显示的地块为地块形状,而非用于未来住宅开发项目的地块面积。关于本清单中拟建的某些地块,只有部分地块用于住宅开发,如教堂或学校后方的场地。用于未来住宅开发的地块无需更换当前用途。例如将停车场变更为新住宅和停车场。
Draft Sites Inventory Details
An important part of the Housing Element process is identifying places for housing to be built. Alameda County itself will not build this housing, but through programs and policies the County will incentivize and further enable others, such as nonprofit and for-profit developers or land owners, to develop housing. The Sites Inventory is a list of parcels of land suitable for housing.
Alameda County is required to describe sites for at least 4,711 units of housing.
Planning staff are required to ensure there is land available in the Housing Element inventory throughout the planning period (2023-2031) to meet the 4,711 units goal. For example, if a piece of land that could have held 40 units is developed with only 10 units, staff are responsible for finding and, if needed, rezoning another piece of land to account for the 30 unit difference. This is known as the No Net Loss rule. You may notice that the table below has a total of 5,216 units. Staff have created a Draft Sites Inventory with the No Net Loss rule in mind.
Projected Units of Housing by Density/Income Category and Community
Below is a summary of the number of units per each community in the unincorporated areas.
| Community | Units Per Area | % Of Total Units | Above Moderate Income Units | Moderate Income Units | Low And Very Low Income Units Per Area | Units Currently Under Development | Units on Sites Proposed for Rezoning |
|---|---|---|---|---|---|---|---|
| Eden Area | 2,210 | 46.0% | 703 | 468 | 1,039 | 333 | 1,502 |
| Ashland | 1,296 | 27.0% | 295 | 285 | 716 | 150 | 939 |
| Cherryland | 247 | 5.1% | 57 | 91 | 99 | 18 | 130 |
| Hayward Acres | 38 | 0.8% | 13 | 24 | 1 | 13 | 18 |
| San Lorenzo | 629 | 13.1% | 338 | 68 | 223 | 152 | 415 |
| Castro Valley | 1,859 | 38.7% | 705 | 352 | 802 | 319 | 1,231 |
| Fairview | 530 | 11.0% | 493 | 28 | 9 | 41 | 382 |
| East County | 204 | 4.2% | 197 | 3 | 4 | 204 | - |
| Total | 4,803 | 100.0% | 2,098 | 851 | 1,854 | 897 | 3,115 |
| Projected ADUs | 413 | 42 | 124 | 248 | - | - | |
| Total Including ADUs | 5,216 | 2,140 | 975 | 2,102 | - | - | |
Comparison with Previous Housing Element
The tables below compare unit numbers from the most recent Housing Element (2015-2022) and the current update (2023-2031). The first table compares the Regional Housing Needs Assessments for the 2015-2022 and 2023-2031 Housing Elements. There has been a significant increase in units (more than double) throughout the Bay Area, and this is reflected in the increase described here. As of 2021, only 35% (621) units of housing were built during the 2015-2022 Housing Element.
| Comparison of Regional Housing Needs Assessment (RHNA) numbers | |||||
|---|---|---|---|---|---|
| Housing Element Cycles | VERY LOW INCOME (<50% of Area Median Income) | LOW INCOME (50-80% of Area Median Income) | MODERATE INCOME (80-120% of Area Median Income) | ABOVE MODERATE INCOME (>120% of Area Median Income) | TOTAL |
| 2015-2023 | 430 units | 227 units | 295 units | 817 units | 1,769 units |
| 2023-2031 | 1,251 units | 721 units | 763 units | 1,976 units | 4,711 units |
| % Increase | 191% | 218% | 159% | 142% | 166% |
The second table, below, compares the number of units identified per community for the most recent Housing Element (2015-2022) and the current update (2023-2031).
The most substantial changes between the 2015-2022 Housing Element and 2023-2031 Housing Element are in the number of units located in the Eden Area and Castro Valley. The percentage of possible future units located in the Eden Planning Area (approximately 8.8 square miles in size) decreased from 72.4% of all units to 46% of all units. This reflects significantly smaller unit allocations in Cherryland and Hayward Acres. While the overall percentage of units in San Lorenzo fell from 19.6% to 13.1% of the total number of units per year, the actual number of units increased from 444 to 629. The percentage of units in Ashland increased from 19.8% to 27%, and the number of units also increased from 449 to 1,296.
The percentage of possible future housing units located in Castro Valley (approximately 10.5 square miles in size) increased from 17.7% (402 units) to 38.7% (1,859 units). The percentage of units in Fairview increased slightly, from 9.8% to 11.0%; this corresponds with an increase from 223 units to 530 units in the most current Housing Element sites inventory.
The last significant change from the previous Housing Element to the current update is the inclusion of development projects in eastern Alameda County, 204 units or 4.2% of all units in the sites inventory.
| Total Units for 2015-2022 Housing Element | Percentages of total units for 2015-2022 Housing Element | Current Identified Units for 2023-2031 Housing Element | Percentages of Current Identified Units for 2023-2031 Housing Element | |
|---|---|---|---|---|
| Eden Area | 1,641 | 72.4% | 2,210 | 46.0% |
| Ashland | 449 | 19.8% | 1,296 | 27.0% |
| Cherryland | 413 | 18.2% | 247 | 5.1% |
| Hayward Acres | 335 | 14.8% | 38 | 0.8% |
| San Lorenzo | 444 | 19.6% | 629 | 13.1% |
| Fairview Planning Area | 223 | 9.8% | 530 | 11.0% |
| Castro Valley Planning Area | 402 | 17.7% | 1,859 | 38.7% |
| East County Planning Area | 0 | 0.0% | 204 | 4.2% |
| Grand Total | 2,266 | 100.0% | 4,803 | 100.0% |